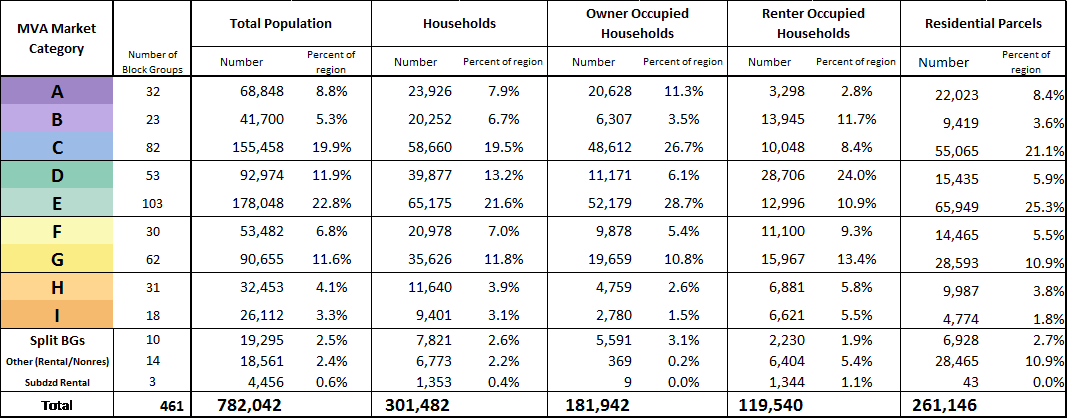
- 32 of the region’s 461 block groups have been characterized as “A” markets.
- 8.8% (68,848) of the region’s 2011-2015 population and 7.9% (23,926) of its households.
- Typical home sales price in “A” markets is approximately $501,292, nearly 2.5 times the regional median.
- Highest average percentage of properties (5.9%) that have been built in the last 10 years
- Elevated rates of permitting activity (11.6%) relative to the regional average.
- Owner occupancy rates (90.1%) well above the regional average.
- “A” markets have the lowest level of bank sales (2.6% of sales) in the region.
- There are few publicly subsidized rental housing options in these markets (0.4% of all rental units).
- “A” markets are the least dense housing market with an average only 1.9 housing units per residential acre.
Market Type B
- High 23 of the region’s 461 block groups have been characterized as “B” markets.
- Highest density of all of the markets at an average of 17.2 housing units per residential acre
- 5.3% (41,700) of the region’s 2011-2015 population and 6.7% (20,252) of its households.
- At nearly $426,000, the “B” markets’ typical home sales price is just over two times the regional median.
- Permitting activity (5.0%) is slightly below the regional average.
- “B” markets are predominantly renter occupied, with 33% of all households being owner occupied.
Market Type C
- 82 of the region’s 461 block groups have been characterized as “C” markets.
- More suburban in form, with an average of 3.2 housing units per acre
- 19.9% (155,458) of the region’s 2011-2015 population and 19.5% (58,660) of its households.
- Home sale prices ($274,479) above the regional average.
- Permitting activity (7.2%) is second highest in the region.
- Predominantly owner occupied (83%); of the limited number of rental properties, few (3%) are publicly subsidized.
- The average rate of bank sales, 6%, is double that of “A” and “B” markets.
Market Type D
- 53 of the region’s 461 block groups have been characterized as “D” markets.
- 11.9% (92,974) of the region’s residents and 13.2% (39,877) of its households.
- The typical home sale prices in “D” markets ($195,175) is just under the regional average.
- Permitting activity in “D” markets (5.7%) is just under the regional average.
- Lowest average homeownership rate (29%)
- Second highest density (9.8 units per acre) of all of the markets.
- Comprise over 28,700 rental households, with an average of 7% receiving some form of subsidy.
Market Type E
- 103 of the region’s 461 block groups were characterized as “E” markets.
- These block groups were home to 22.8% (178,048) of the region’s 2011-2015 population and 21.6% of its households.
- The typical home sales price in “E” markets is approximately $182,686, roughly 10% below the regional average.
- The market is largely (80%) owner occupied, third highest in the region.
- Bank sales are roughly equal to the regional average.
- Percent of presidential properties built since 2008 (2.6%) is slightly below the regional average.
- Permitting activity in “E” markets (5.5%) is slightly below the regional average.
Market Type F
- 30 of the region’s 461 block groups were characterized as “F” markets.
- 6.8% (53,482) of the region’s 2011-2015 population and 7% (20,978) of its households.
- The typical home sales price in “F” markets is approximately $140,358, just over two-thirds the regional average
- On average, 21% of all sales are bank sales.
- Permitting activity in “F” markets (10.6%) is the third highest rate in the city.
- These markets are nearly evenly split between owners (48%) and renters.
- Of the renter households, an average of 77% per block group are receiving public subsidy; the second highest level in the region.
Market Type G
- 62 of the region’s 461 block groups were characterized as “G” markets.
- 11.6% (90,655) of the region’s 2011-2015 population and 11.8% (35,626) of its households.
- At $117,611, typical home sales prices in these “G” markets are just above half the regional average.
- In a typical block group, nearly 30% of all sales are by banks.
- An average of 59% of households own their home, the fourth highest average of all markets.
- Of the renter occupied households, on average 6.5% of them are subsidized.
- The third highest vacancy rate (3%) of all market types.
- Permitting activity in “G” markets (4.9%) is below the regional average.
Market Type H
- 31 of the region’s 461 block groups were characterized as “H” markets.
- 4.1% (32,453) of the region’s 2011-2015 population and 3.9% (11,640) of its housing units.
- The typical home sales price in “H” markets is $63,465, just below one-third the regional average.
- On average, bank sales account for 32.8% of all sales in “H” block groups.
- Permitting activity in “H” markets (3.7%) is the second lowest of all market types.
- “H” markets typically have 41% homeowners and 59% renters.
- On average 12% of renter households receive public rental subsidy, the third highest percentage among market types.
- Average vacancy rates in “H” markets (8.5%) are the highest in the region and over 2.5 times as high as the next highest market.
Market Type I
- 18 of the region’s 461 block groups were characterized as “I” markets.
- These block groups are the third most densely built (7.2 units per residential acre)
- 3.3% (26,112) of the region’s 2011-2015 population and 3.1% (9,401) of its households.
- The typical home sales price in these “I” markets is $53,597, approximately 25% of the Richmond regional average.
- Permitting activity in “I” markets is the lowest in the region at 2.0%.
- “I” markets typically have 30% homeowners and of the 70% that are renters.
- On average, 89% of the renter households are receiving some form of subsidy.