Background
In 2021, Richmond Memorial Health Foundation (RMHF) in partnership with PlanRVA commissioned a second Market Value Analysis (MVA) of the Richmond region. The first MVA was completed in 2017 as part of RMHF’s portfolio of activities associated with its participation in the Robert Wood Johnson Foundation-funded Invest Health program. Invest Health was a collaboration of teams of organizations in small and mid-sized cities across the US with the purpose of enabling and supporting connections between traditional housing and community development activities and community health. The MVA in 2017 became a vehicle through which RMHF could bring together a set of regional actors that were working to focus on issues impacting community health through the lens of Richmond’s complex, multi-dimensional housing market. The first MVA brought to light a number of issues that became central to advancing RMHF’s racial equity imperative. “The MVA process set the stage for RMHF’s evolution and new Strategic Framework, encouraging us to lean into housing and the built environment as a social determinant of health and go deeper into research and data, policy and advocacy, and civic engagement,” shares Mark Constantine, RMHF President & CEO. “We are grateful to Ira Goldstein and the Reinvestment Fund team for their expertise and ongoing leadership.”
What is the MVA?
 The MVA is a creation of Reinvestment Fund’s Policy Solutions group (Policy) led by Ira Goldstein. The very first MVA was completed in Philadelphia as part of a nearly $300 million set of investments in its neighborhoods called the Neighborhood Transformation Initiative. It is a data-based, field-validated analysis and mapping of a community’s housing market. While the MVA includes a regional view, the analysis is done at a very small geographic scale, making it possible for the MVA’s depiction of a city’s neighborhoods to reveal the mosaic of market conditions within the community. The MVA typically relies on administrative data, which is timelier and more geographically refined than, for example, data from the US Census. And the MVA process typically includes field validation by a team of Policy staff, as well as convenings with local subject-matter experts.
Since the initial MVA in Philadelphia, Policy completed MVAs in cities ranging in size from Selma, AL (population under 20,000) to Houston, TX (population nearly 2.3 million). What made the Richmond MVA unique is the entities that were/are involved. Our process brought together a community development financial institution (CDFI), a city department, a regional planning entity, and a foundation.
| Communities with MVAs | ||
| Allegheny County, PA | Irving, TX | Pittsburgh, PA |
| Atlantic City Area, NJ | Jackonsville, FL | Prince George’s County, MD |
| Baltimore, MD | Kansas City, MO | Reading Area, PA |
| Bethlehem, PA | Milwaukee, WI | Richmond, VA |
| Camden, NJ | Mt. Vernon, NY | San Antonio, TX |
| Dallas, TX | New Jersey (8 regions) | Selma, AL |
| Denton, TX | New Orleans, LA | St. Louis, MO |
| Detroit, MI | Newark, NJ | State of Delaware |
| Houston, TX | Northampton County, PA | Washington, D.C. |
| Indianapolis, IN | Philadelphia, PA | Wilmington, DE |
Many cities choose to redo their MVA every three years as a way of developing a trusted and consistent metric upon which market change can be measured. And MVAs have been used in many creative and constructive ways, from supporting fair housing analyses, targeting code enforcement activity, measuring neighborhood change, enhancing equitable development strategies, incenting low-income housing development, informing land bank acquisition/disposition strategy, to name a few. There were many uses of that first MVA in Richmond, including its incorporation into the award-winning Richmond 300 Master Plan. In fact, Richmond 300 called for updating the MVA in a few years.
As important as the 2017 MVA was for Richmond area efforts, RMHF sought again to use the MVA project as an organizing vehicle to facilitate a more fulsome community engagement strategy, to bring voices to the table that heretofore generally were not active participants, to democratize access to the data leveling the playing field between residents and policymakers, and to further enhance RMHF’s racial equity priority.
The 2022 MVA Process
In order to achieve the contemporary goals, RMHF’s Program & Strategy Officer, Michael Smith began laying the groundwork for the 2022 MVA months before the project kickoff. Early work began with partners from PlanRVA, the City of Richmond’s Department of Planning and Development Review and Reinvestment Fund to collect learnings from the prior MVA and to identify and recruit a broader set of stakeholders who would participate in various aspects of the MVA process. RMHF organized a stakeholder group that met virtually five times between October 2021 and March 2022; there was also a data subgroup, resident engagement subgroup, and investment strategy subgroup. These groups convened separately on specific data and analytic issues. In each of these meetings the accuracy and actionability of the MVA as it was evolving was examined, and the policy issues that the analysis presented were raised.
The partners also had the idea that it was going to be important to socialize the new MVA process with its partners and stakeholders and to share data and insights as they became available. To that end, we prepared a newsletter story focused on the MVA and the observed rapidly challenging affordability situation for Richmond area residents. Other activities included a series of small meetings with stakeholders such as the local Federal Reserve Bank, Housing Trust Fund, Community Foundation, and others.
Richmond Area’s 2022 MVA
The MVA is built on a set of housing market indicators gathered, where possible, at the address-level. Those indicators are mapped and validated, and aggregated to the Census-defined block groups. The MVA is constructed using a statistical cluster analysis, which essentially sorts the region’s block groups into categories. Block groups within a category are similar as measured by the indicators. The categories though, are different. Field and stakeholder validation of the cluster analysis – like the market indicators themselves – are essential to the process.
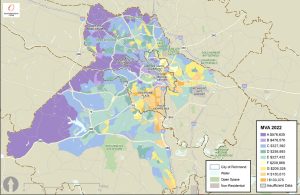
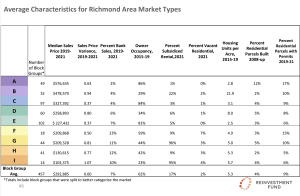
The columns of the table show the market indicators used in the 2022 MVA. Rows of the table represent the market categories. Entries in the cells of the table indicate the typical indicator value for the given market category. For example, typical block groups in I markets have sale price of $103,375 and a 23% owner occupancy rate. A summary of the MVA and final presentation are available here.
Selected 2022 MVA Headlines
Richmond Area’s Housing Prices Remain High, Even in “Stressed” Markets
Comparisons of the Richmond area’s 2017 MVA to other communities with MVAs demonstrated that the most distressed markets in Richmond (i.e., distressed markets tended to have lower sale prices, elevated bank sales, high concentrations of subsidized rental housing and lower levels of permitting activity) had unusually high typical sale prices: $53,597; slightly less distressed averaged $63,465. Reinvestment Fund’s analysis of stressed markets in other cities at that time showed that a unique trait of the Richmond area was the relatively high prices in stressed markets. Today, the typical sale prices in stressed markets are $103,375 and $130,615. Not only has there been an extraordinary rise, but again, housing costs even in stressed Richmond markets are high compared to other cities.
Housing Price Increases Exceed Income Increases, Challenging Affordability
Housing prices, a key component of the MVA, rose dramatically. Overall, the percent of homes selling for less than $250,000 fell from 48% to 34% in just four years between 2018 and 2021; the percent selling for more than $450,000 rose from 15% to 21%. Rises such as this, which exceed increases in family incomes, show the increasing pressure experienced especially for people of modest means.
If we look at current Richmond city residents, those earning below 50% of the median household income could afford to purchase a home in a very small share of the city’s block groups, and all those block groups were places manifesting significant signs of market stress. This analysis, thought of as the “geography of opportunity” – or how opportune are the places where can people afford to live – a comparison of the 2017 and 2022 MVAs show a real constriction of that opportunity, even for middle income families. Further, because households of color tend to earn less than White households, the geography of opportunity for Black and Hispanic families is far more restricted at every income level.
Investor Purchasing may be Limiting Opportunities for Generational Wealth Building
Field validation and stakeholder discussions raised the issue of investor purchasers of homes in the Richmond area. Recent media reports underscore the penetration of private investors in the Richmond area housing market. As part of the MVA process, home sales were categorized as owner to owner, owner to investor, investor to owner and investor to investor. In the most stressed markets, 39% of home sales were owner to owner; in the strongest markets (i.e., areas with relatively high sale prices, very little vacancy, higher levels of new construction, and high permitting activity), over 80% were sales of this nature. Conversely, in the most stressed markets, 25% of sales were from owners to investors compared to under 5% in the strongest markets. Implications for Black and Brown homeownership are concerning, and as the home has historically been the way families accumulate wealth and pass it from generation to generation, so too are implications for growing racial wealth disparities.
Using data from the Home Mortgage Disclosure Act, we observed that 44% of sales in the most stressed markets had mortgages (i.e., 56% were likely cash transactions) compared to 77% in the strongest markets. Without the lifeblood of a community represented by the flow of mortgage capital, it is very difficult for that neighborhood – and its residents – to thrive.
Changing Dynamics Increase Risk of Displacement
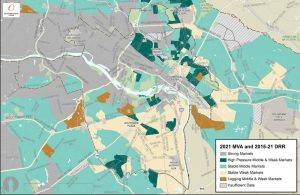
Lastly, several parts of the region experienced such extraordinary increases in home sale prices in comparison to income that the residents are at risk of financial displacement. Moreover, the ability of people of similar economic means to replace them if they choose to leave the neighborhood is impaired; price increases are so steep that only higher income people can afford to buy in. Areas on the map in the dark shade of green are middle market areas that are under that economic pressure. These are places that are at risk of falling out of affordability for middle income households. On the other end of the spectrum are the places that are shaded brown. These are places that are middle and stressed market areas that are at risk because they are lagging the region. Conditions may be deteriorating in relation to other places, and the residents may feel pressure to leave because their neighborhood is no longer giving them what they want and need from a neighborhood.
Next Steps
Now that the 2022 MVA is complete, it’s time for stakeholders to do the work to ensure that it is fully accessible and integrated into the planning and implementation of the many community-focused efforts around the region. First, the MVA will find a home at PlanRVA. Thanks to funding from Virginia Housing, the MVA will be available as an online interactive map with contextual resources and narratives to explain the data and key findings. Over the next few months, a series of map-centric, issue-focused illustrations will be created and released. Second, we have committed to making the MVA and component data available to practitioner, academic, and other user-groups who can enhance their research with the MVA. Third, there is a plan to develop a set of traditional and social media features of the MVA and some novel local uses that other communities with MVAs across the US have used. Fourth, we will support presentation and engagement opportunities around the region with groups of practitioners and policymakers for whom the MVA can be a critical tool. Lastly, Reinvestment Fund is planning a Community of Practice in the southeast region in late 2022/early 2023 that will include opportunities for MVA users from across the country to collaborate on implementation successes and challenges.